 Back to Research
Back to Research
Back to Research
|
The study of chaotic systems comprises of an exciting development in mathematics and physics, and in applied fields such as mathematical biology and meteorology. The implication on the analysis of observed time series is that, since many real-world processes have been traditionally modeled by deterministic systems through various physical laws, the appearance of unexpected osicillations, or randomness may be caused by the intrinsic nonlinear dynamics. (The top figure on the right-hand side shows clear a geometric structure in the state space of trajectory from
Competitive Lotka-Volterra equations
, though each invidual component is clearly aperiodic and looks as random as any typical time series.) In contrast,
empirically stochastic models such as ARMA models try to explain the randomness through externally driven infinite-dimensional noise process, so they do not
provide the insight and simplicity of deterministic systems. Indeed, all stochastic systems considered so far are stable systems in the absence of external noise so they fail to include the type of chaotic behaviors which are potentially prevalent among simple deterministic systems. Besides instability with initial conditions, another distinguishing feature of chaotic systems is the rich and beautiful geometric structure in the state space (or the attractor where the trajectory lies), so-called
fractal geometry.
An emerging field is recent revival in complex systems , such as complex fluid and complex biological systems, so-called systems biology, see the systems-bio timeline. |

|

The 3-variable Lorenz system from Lorenz (1963), developed by E N Lorenz , is one of the most famous differential systems, serving as the simplest toy weather model for demonstrating the butterfly effect in much complex numerical weather prediction systems. I did a predictability study of this system around 1995-1996 through the local Lyapunov exponents tool developed in my dissertation.
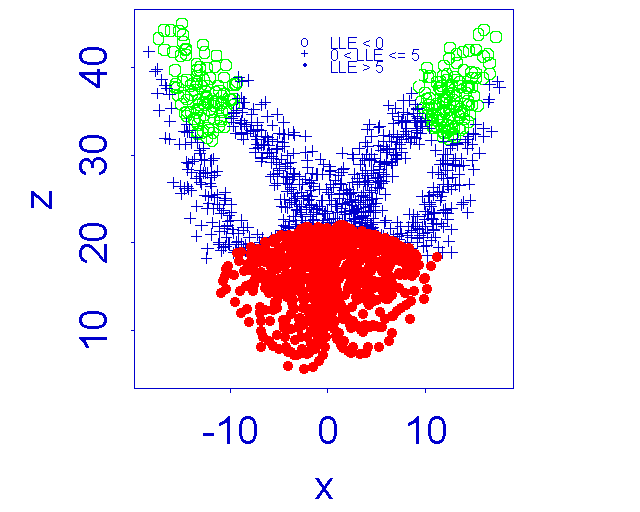 The local local Lyapunov exponents (LLE) are a function of spatial positions
in the state space, characterize the variation of predictability or
unpredictability as the initial condition changes. Through distribution of LLE in space, one may supposedly
find arbitrage opportunities by making prediction at the most opportune
predictable locations and avoiding speculative activities at the least predictable
locations. The spatial map of the
LLE predictability plots of
Lorenz system. (Here shown are the computed time 0.1 LLEs plotted as spatial series and
three projections of the phase space. The symbols (o,+,*) and
colors (green , blue,
red) represent the three regions of
predictable,
unpredictable, and most unpredictable). (The black-white version of the figure
was published in Z.Q. Lu and R.L. Smith 1997 in a book: Nonlinear Dynamics and Time Series , edited by Colleen D. Cutler and Daniel T. Kaplan, pp.135-151.)
The local local Lyapunov exponents (LLE) are a function of spatial positions
in the state space, characterize the variation of predictability or
unpredictability as the initial condition changes. Through distribution of LLE in space, one may supposedly
find arbitrage opportunities by making prediction at the most opportune
predictable locations and avoiding speculative activities at the least predictable
locations. The spatial map of the
LLE predictability plots of
Lorenz system. (Here shown are the computed time 0.1 LLEs plotted as spatial series and
three projections of the phase space. The symbols (o,+,*) and
colors (green , blue,
red) represent the three regions of
predictable,
unpredictable, and most unpredictable). (The black-white version of the figure
was published in Z.Q. Lu and R.L. Smith 1997 in a book: Nonlinear Dynamics and Time Series , edited by Colleen D. Cutler and Daniel T. Kaplan, pp.135-151.)