An Indifference Curve is a graphical representation of a set of comparisons between different combinations of two goods such that all points lying on the line represent an equal sum of measured utility derived by the consumer from the varying combination of the goods. As Dolan and Lindsey state it, Indifference Curve: (def) "A graphical representation of a set of consumption choices, each of which yields the same utility so that no member of the set is preferred to any other." Gertmanian indicates that an indifference curve is" A function that shows how much of one good it takes to make someone ambivalent to a given amount of some other good."
The
Indifference Curve is assumed to be convex for goods that
are desirable. For this to be true we assume that at any
point on the curve the slope must be equal to the
marginal rate of substitution, the rate at which one good
can be substituted for another with no gain or loss in
satisfaction. If the principle of diminishing marginal
utility concurrently holds true, that is, the amount of
added utility gained from a one-unit increase in
consumption of a good decreases as consumption of the
good rises, then we can conclude that the substituted
good taking the place of the lost utility is in less
demand relative to when the consumption of the original
good was relatively lower. Succinctly: "Indifference
curves exhibit a diminishing marginal rate of
substitution if the slope gets flatter as you move to the
right along an indifference curve, meaning as you have
less of a good, it is worth relatively more." (Looking at the curves that border
the indifference curves we are studying we find two
scenarios: In the case of perfect substitutes the
indifference curve will be a straight line with a
constant marginal rate of substitution, or in other words
when goods are perfect substitutes there is no
diminishing marginal rate of substitution. The other
boundary of indifference curve possibility is the
indifference curve for perfectly complementary goods. In
this case there is only one combination of goods where
utility can be maximized per budget.)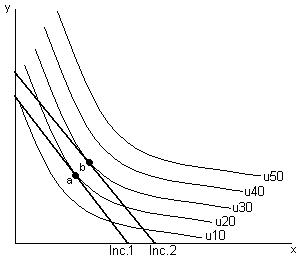
On the graph to the right, the Inc. 1 budget line represents the ability of a consumer to purchase goods to maximize his utility. All points on the u30, u40 and u50 are in excess of his ability to purchase (monetary constraints). Therefore, in order to maximize his utility he must chose the combination of goods as they are represented by the point where his budget line and a indifference curve have the same slope (point his money income to Inc. a). By increasing 2 the consumer can now attain a higher level of satisfaction as shown by the utility derived from the combination of goods as they are represented by the point where his new budget line and the higher indifference curve have the same slope (point b).
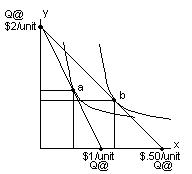 Decreasing
the price of a good has the same effect as increasing the
income for the consumer for the good effected by the
price decrease. Specifically, in looking at the graph to
the right we see that the budget line through point
a represents a lower utility than is achieved
at point b. In order to get to point
b from point a we can either
raise money income or, in this case, lower the price of
the good so that the budget line is tangent to the
indifference curve at a higher level of utility.
Increasing the price of a good has the opposite result
for normal goods. Specifically, the utility would be
lowered and the new budget curve in this graph would be
steeper than the original line through point
a.
Decreasing
the price of a good has the same effect as increasing the
income for the consumer for the good effected by the
price decrease. Specifically, in looking at the graph to
the right we see that the budget line through point
a represents a lower utility than is achieved
at point b. In order to get to point
b from point a we can either
raise money income or, in this case, lower the price of
the good so that the budget line is tangent to the
indifference curve at a higher level of utility.
Increasing the price of a good has the opposite result
for normal goods. Specifically, the utility would be
lowered and the new budget curve in this graph would be
steeper than the original line through point
a.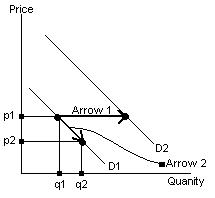
Change in demand is a function of utility (or external pressure), change in quantity demanded is a function of price. The graph represents this change in demand as the movement of the demand curve so that, at all prices, there is an increase or at there is a decrease (arrow 1). The change in quantity demanded is the shift along the demand curve due to the change in price. Change of demand can be for many reasons including change in income and perceived beneficial/detrimental utility. (The substitution and income effects can also effect change in quantity demanded, see below)
The substitution effect is the portion of an increase in quantity demanded of a good whose price has fallen. This is caused by the substitution of that good for others that are now relatively more costly. For example, when the price of video rentals dropped in the early 90s the cost of actually going to the movies became relatively more expensive as compared to renting a movie. A portion of the increased quantity demanded for rental movie is due to the fact that people found it relatively less costly to get their movie watching needs met through rentals as compared to movie going.
In comparing normal goods to inferior goods, we can define inferior goods as goods for which an increase in consumer incomes results in a decrease for demand for that good. For example, when people are living on a limited budget they may buy more generic goods for use in their household. As income increases generic goods are subjected to the fate of inferior goods. Specifically, normal "brand name" goods that carry national reputations will replace these goods. In this case we can expect that as incomes rise the demand for the inferior good (generic brands) to decrease and the demand for normal goods (national brands) will increase.
This is most likely a graph of a demand curve because as the price of the units decrease the quantity demanded increases. If it were a supply curve a decrease in price would be a disincentive to produce anymore and the quantity demanded would decrease.
Numerical Elasticity = 2, for the range studied.
The numerical elasticity of this demand curve can be described as relatively elastic. Specifically, the change in quantity demanded changes 2 percent for every 1 percent that the price changes.
The Brazilian government must have a few conditions met before the destroying of coffee beans is to have its intended effect. First there should be no substitute for the Brazilian bean. If a Colombian bean will suffice, then as the price of the Brazilian bean goes up the demand for the substitute will go up and the quantity of bean demanded from Brazil will be diminished. This decrease in quantity demanded may decrease the net revenue even with the price increase. Secondly, if there is no immediate substitute the demand for the good should be relatively inelastic otherwise consumers will lower the quantity demanded (as per the elastic demand curve scenario) and the increase in price will cause the overall net revenue will fall. Lastly there must be significant penalty for not following the law. Criminally producing the beans to sell on the illegal market should be interdicted and the perpetrators struck with stiff fines. All of this will lead to an insurmountable opportunity cost in breaking the law and allow the unnatural pressure on the market to have its intended effect.
The number of units that must be sold to maximize revenue given TR=27Q-Q3 is 3 units.