Linear Least-Squares Fitting
There are many situations in chemistry and the other sciences where there is
an inherent linear variation between a dependent variable (say, y) and an independent variable
(say, x). You must be knowing that a linear variation between the variables x
and y is expressible by the relation y = mx + c, where m and c are two
constants. For example, in reaction kinetics for 1st order reactions, there
exists an inherent linear variation between log [A], i.e., the logarithm of molar concentration of
the reactant A on one hand, and the time t on the other. (The exact relation for
this inherent variation is
log [A] = (–k/2.303).t + log [A]o, where
m equals –k/2.303 and c equals log [A]o).
However, due to experimental errors of measurement occurring in varying extents
for the various
(xi, yi) points (where i = 1, 2, 3, ....,
n), the experimental (xi, yi) points for a given set of
such measurement generally do not exactly lie on a straight line (in absence of
experimental errors, they would have surely lied on a line, because of the
aforesaid inherent linear variation). For example, in case of a 1st order
reaction, there (naturally!) arises various experimental errors in measuring the
varying reactant concentrations [A]i, because of which the points (ti
,
log [A]i) do not exactly fall on a straight line (you must have
experienced that yourself). So, to minimize the underlying experimental errors
in measuring the various points, an obvious way would be to find a straight line
that runs as close to the experimental points as possible, with the points not
falling on the line being allowed to lie along both the sides of the line in nearly
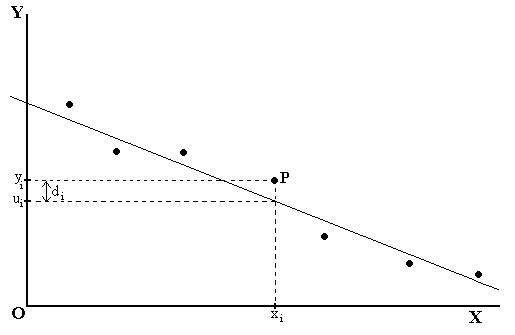
equal extents (see figure).
One frequently finds such a straight line manually, simply by carefully observing
the points and choosing such a line. However, there is a statistical way of
finding such a straight line employing definite mathematical operations, this
method being known as the
method of linear least-squares fitting. In this method, we consider the
deviation di of the experimental value (say, yi) of the
dependent variable from its value on the chosen straight line (say, mxi +
c = ui),
corresponding to the value of the independent variable (say, xi) for
that point (in above figure, consider the point P). This means, di = yi – (mxi +
c) = yi – mxi – c. Note that the deviation is
considered wholly along the vertical direction (see above figure). The sum S of
the squares of these deviations for all the n experimental points (i.e., S = Si di2)
is then minimised to get the proper straight line (where n is the number of
experimental points in the given set).
The deviations themselves are not summed, because positive and
negative deviations have a tendency of cancelling one another even for large
individual deviations! So, to always have a smaller sum S indicate smaller
individual deviations, it is advisable to consider the sum of the squares
of the deviations. Also, because of squaring, larger individual deviations
become more significant in deciding the line to choose.
We thus get, S = Si di2
= Si (yi – mxi –
c)2 = Si (yi2
+ m2 xi2 + c2 – 2mxiyi –
2cyi + 2mcxi)
= Si yi2
+ m2 Si xi2
+ n c2 – 2m Si xiyi
– 2c Si yi + 2mc Si xi
Where we note that the constant c2 summed n times would simply equal
nc2. Let us, for simplicity, denote the sums Si yi2
as Syy, Si xi2
as Sxx, Si yi2
as Syy, Si xi yi
as Sxy, Si yi as Sy
and Si xi as Sx.
This gives us:
S = Syy + m2 Sxx + n c2
– 2m Sxy – 2c Sy + 2mc Sx ------ (i).
Noting that for a given set of experimental points, the above sums Syy,
Sxx, Sxy, Sy, and Sx are
obviously constants (the xi and yi values have already
been obtained), we find that the sum S is a function of only the two variables m
and c, as per the relation (i).
[The parameters m and c are, however, variables because when one chooses
different straight lines (say, manually) to represent the set of points, m and c
would obviously vary.]
Thus, using concepts of differential calculus about a function of two
variables, we find that for S to be a minimum, (∂S/∂m)c = 0 and (∂S/∂c)m
= 0. Employing equation (i), the differentiations give:
0 + 2mSxx + 0 – 2Sxy + 2cSx
= 0 and 0 + 0 + 2cn – 2 Sy + 2m Sx = 0. Rearranging and
dividing both the relations by 2, we get the following two linear equations in the
two unknowns m & c:
Sxx m + Sx c = Sxy ---- (ii)
and Sx m + n c = Sy ---- (iii).
To solve these two equations, we first multiply equation (ii) with n and
equation (iii) with Sx, then subtract the second result from the
first.
This gives m = (nSxy–SxSy)/(nSxx–Sx2).
Next we multiply equation (ii) with Sx and equation (iii) with Sxx,
then subtract the first result from the second. This gives c = (SxxSy–SxSxy)/(nSxx–Sx2).
Note that the denominator is common in both the expressions -- commit it (and
also the two numerators) to memory!
The above two expressions for m & c are rather easy to remember for their
symmetry and dimensional characteristics. Count the number of x and y in any
numerator or in the denominator terms -- they're same (e.g., two x-s are there
in both denominator terms i.e., in nSxx and Sx2)!.
The left (plus) term always tend to have them together (as in nSxx or
in nSxy), whereas the right (minus) term tend to have them separate
(as in Sx2 or in SxSy): if in this
way there occurs only one sum in the left term, there remains the n factor
instead. Dimensionally, m must obviously (considering the basic relation y = mx
+ c) have the dimension of y/x and c the dimension of y. This is wholly
consistent with the fact that there is one x and one y in the numerator for m
and two x-s in the (common) denominator, whereas there is two x and one y in the
numerator for c. So, even if you forget, you can make out the two expressions.
A good technique to perform a linear least-square fitting calculation on a given set of points is probably to make a table with columns for xi, yi, xi2 and xiyi values. The sum of these four columns would conveniently provide the values of the sums Sx, Sy, Sxx, and Sxy, which values may then be put in the expressions for m & c to calculate these two parameters (see the following problem). Free software packages are also available for performing linear (or higher-power) least-square fitting for one-variable (or even two-variable) situations; for such automated calculations, this author prefers the Power-Surface package developed by him.
Problem: In kinetic investigation of acid hydrolysis of AcOMe, the titre volumes Vt of NaOH solution remains involved in the linear relation log (Va–Vt) = (–k/2.303) t + log (Va–Vo). At time t = 0, 10, 20, 30, 45 & a min., a student observed titre values Vt = 24.2, 25.9, 27.5, 29.0, 31.1 & 44.7 mL respectively. Find the rate constant k using linear least-squares method.
Answer: Denoting time t as xi (and naturally excluding the infinite-time point at t = a -- that's required only to know Va), and log (Va–Vt) as yi, we construct the following table with 5 points (i.e., n = 5):
| Point No. |
xi = t (time t in minutes) |
yi = log (Va–Vt) | xi2 | xi yi |
| 1 | 0 | 1.312 | 0 | 0.00 |
| 2 | 10 | 1.274 | 100 | 12.74 |
| 3 | 20 | 1.236 | 400 | 24.72 |
| 4 | 30 | 1.196 | 900 | 35.88 |
| 5 | 45 | 1.134 | 2025 | 51.03 |
| TOTAL | 105 | 6.152 | 3425 | 124.37 |
Thus we get n = 5, Sx = 105, Sy = 6.152, Sxx
= 3425 and Sxy = 124.37
This gives m = (5 x 124.37 – 105 x 6.152)/(5 x 3425–1052) = –0.003952,
and c = (3425 x 6.152 – 105 x 124.37)/(5 x 3425–1052) = 1.313.
So we get m = (–k/2.303), implying k = –2.303 m. This gives k = 9.101
x 10–3 (min–1).