 Ion PlotIon Plot
Location: View Menu on the Peptide Sequence Fragmentation Modelling window
The ion plot window can be used to visualize the expected mass spectrum for the predicted fragmentation ions. In addition, the location of actual ions loaded for matching can be compared to the predicted ion locations. In order to minimize download time, simplify installation issues, and keep the program free, the plotting routine is not as fast as commercial plotting routines and can become particularly slow for large data sets or when drawing Gaussian peaks. For this reason, I have added options to help speed up the plotting on slower computers (see Plotting Quality below). In addition, you can export the list of ions using File | Export Data. A comma separated values (.Csv) file will be created containing x and y data pairs for all of the displayed ions. This file can be opened using Microsoft Excel or numerous plotting software packages.
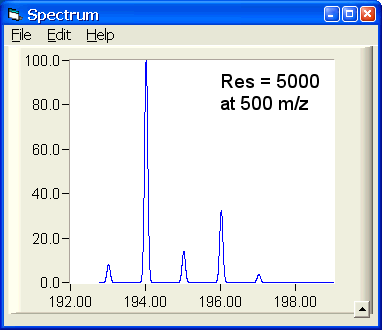
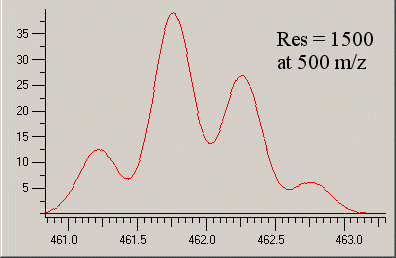
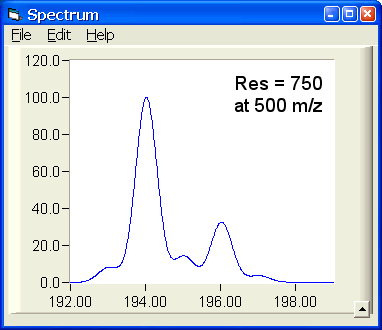
The ions can be plotted as Sticks to Zero or as Gaussian peaks by choosing Plot Type under the Options menu. A stick plot updates much faster, but a Gaussian plot looks better since it more closely resembles actual data and can take instrument resolution into account. The width of the Gaussian peaks can be modified by specifying the resolution specification values (Options | Set Effective Resolution). The higher the resolution, the sharper the Gaussian peak. Typically, Quadrupole instruments have resolutions between 500 and 5000. Time of Flight (including Q-Tof) instruments have resolutions of 5000 to 30,000. Fourier Transform ICR (FT-ICR) instruments have resolutions ranging from 50,000 to 1,000,000.
Resolution in mass spectrometry is technically only valid at a single given mass, since it is computed by dividing the mass by the smallest spacing between two masses that can be discerned (m ÷ ΔM). For this reason, you must also specify an X value (mass) at which the resolution applies. At lower resolutions, the Gaussian representation of adjacent peaks may begin to blend together, a phenomenon commonly seen on lower resolution instruments. The following four pictures illustrate the plot produced for the same four masses at four different resolutions.
|
|

|
|
Two plot quality options can be modified in order to speed up the drawing of the plot, or to improve the quality of the plot. The first option is the Gaussian Representation Quality factor. This factor affects the number of data points used to draw the Gaussian representation of each peak. Higher values result in smooth Gaussian curves, but result in slower plot updates. The default value is 20.
The second option is the Plotting Approximation Factor. Since there are only so many pixels present on the screen, I approximate the representation of the data when there are a large number of data points to be displayed. This is particularly true when displaying Gaussian Peaks, since each ion may produce a Gaussian peak of several 100 data points or more. The approximation factor affects the number of data points that are skipped when approximating the data to display. Higher numbers result in faster updates, but may distort the plot shape. For example, the Gaussian representation of 100 ions might be 10,000 data points. With a screen width of 1024 pixels and an approximation value of 10, every 7th point will be plotted, decreasing the number of points to plot to 1429. Raising the approximation value to 20 results in just 714 points being plotted, speeding the update time, but decreasing plot quality.
To zoom in, simply drag the mouse to form a box. Left clicking inside the box will zoom in. Right clicking will bring up a context menu showing additional zoom options, including zooming in horizontally or vertically, or zooming out in similar ways. You can also choose any of the zoom options using the Zoom menu that appears once a zoom box has been drawn. After zooming in (or out), you can choose Zoom Out to previous from the Options menu to change to the previous zoom limits. Alternatively, right click anywhere on the plot to zoom out. To show the entire plot, choose Options | Zoom Out to show All, or press Ctrl+A.
You can specify an X or Y range to view by choosing Set X Range or Set Y Range from the options menu. The Y axis can also be automatically scaled as you zoom in or out by choosing Autoscale Y Axis. Alternatively, you can turn off Y Axis Autoscaling, but enable Fix Minimum Y at Zero so that the Y axis ranges from 0 to the maximum of any peaks in the current view. Both Autoscaling and fixing the minimum Y at zero are useful to simplify zooming into regions of the plot without requiring you to highlight an entire peak vertically prior to zooming.
The plot can be panned -- meaning to move the plot around left/right or up/down -- by one of two methods. The first is to press and hold the space bar, then drag the plot the distance you wish to move the plot. When you release the space bar, panning will be turned off and zoom mode will be re-enabled. The second method is to choose Cursor Mode | Move from the Options menu. This will turn on panning until you turn it off again choosing Cursor Mode | Zoom. Panning a plot with Gaussian peaks is a fairly slow process, due to the amount of data points that must be redrawn on the screen during the process. Enabling Sticks to Zero mode will greatly increase the speed that the plot can be panned.
Various other options can be set by choosing the appropriate item from the options menu. X and Y Axis gridlines may be displayed on the plot. The approximate number of ticks to label can also be specified for each axis. The number is approximate because the program tries to prevent adjacent tick labels from overlapping. A legend can be displayed. Finally, the current position of the cursor on the plot can be displayed (mass, intensity).
Back to the Molecular Weight Calculator download page